Teacha
  • Courses
  • Mock Exams
  • For Tutors
  • For Schools
  • Pricing
Log InStart Free
  1. Past Questions
  2. /
  3. BECE JHS
  4. /
  5. Mathematics
  6. /
  7. 2000
  8. /
  9. Q28
Question 28

```The bar chart shows the mark distribution of pupils in a test. Use it to answer questions 27 and 28
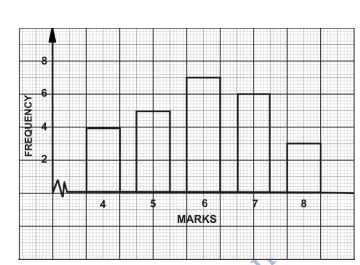
```How many pupils took the test?

  • A.5
  • B.20
  • C.25
  • D.30
  • E.37
Objective

Question details

Exam body
BECE JHS
Subject
Mathematics
Year
2000
Question no.
#28
Type
Objective
Previous · Q27```The bar chart shows the mark distribution of pupils in a test. Use it to… Next · Q29 A school has a population of 600. Out of this, 120 are girls. What is the…

More from this paper

  • Q24The marked price of a radio set is ¢450,000. A discount of 5% of the marked…
  • Q25If 60% of the pupils in a school is 240, find the total enrolment in the school.
  • Q26If a * b = 2a – b, evaluate 4 * 3
  • Q30If 1/k = 1/k 1 + 1/k 2 , find k when k 1 = 1 and k 2 = 2.
  • Q31Solve the equation 13x – 2 (3x + 4) = 22.
  • Q32A rectangular tank is 4m long, 3m wide and 2.5m high. What is the volume of the…
See all Mathematics 2000 questions
Teacha

Africa's learning & exam readiness platform. Built for students, tutors, and schools.

Platform

  • Courses
  • Mock Exams
  • Past Questions

For You

  • I'm a Tutor
  • I'm a School
  • Pricing

© 2025 Teacha. Built for African learners, tutors, and schools. Teacha is not affiliated with WAEC, NECO, or JAMB. All past questions are sourced from publicly available materials.

Privacy PolicyTerms of UseCookie Policy