Teacha
  • Courses
  • Mock Exams
  • For Tutors
  • For Schools
  • Pricing
Log InStart Free
  1. Past Questions
  2. /
  3. JAMB
  4. /
  5. Economics
  6. /
  7. 2004
  8. /
  9. Q0
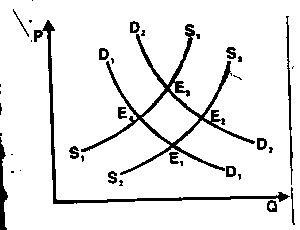
Question 0Question image

The diagram above shows the shifts in both demand supply curves. What is the new equilibrium point after the shifts?

  • A.E3
  • B.E1
  • C.E4
  • D.E2
  • E.
Objective

Question details

Exam body
JAMB
Subject
Economics
Year
2004
Question no.
#0
Type
Objective
Previous · Q0The table above shows the combinations of beans and rice that can be purchased… Next · Q0 When there is a change from T to N, it implies that

More from this paper

  • Q0Given that Y = C + I and C = bY where b = 0.8, what is the multiplier?
  • Q0By advertising, a monopolistic competitive firm tries to shift its
  • Q0The role of the Central Bank in the economic development of Nigeria is to
  • Q0At the maximum point of the total product curve of a firm, marginal revenue is
  • Q0The primary function of non-bank financial institutions is to
  • Q0In an open economy, the GNP is measured as
See all Economics 2004 questions
Teacha

Africa's learning & exam readiness platform. Built for students, tutors, and schools.

Platform

  • Courses
  • Mock Exams
  • Past Questions

For You

  • I'm a Tutor
  • I'm a School
  • Pricing

© 2025 Teacha. Built for African learners, tutors, and schools. Teacha is not affiliated with WAEC, NECO, or JAMB. All past questions are sourced from publicly available materials.

Privacy PolicyTerms of UseCookie Policy