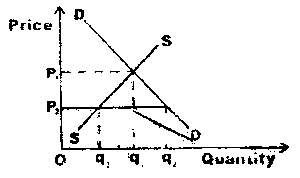
Question 0The diagram above shows the effect ofA.excess demand over supply at q3B.excess supply over demand at q2C.minimum price legislation at P2D.maximum price legislation at P2E.Objective Show full explanation