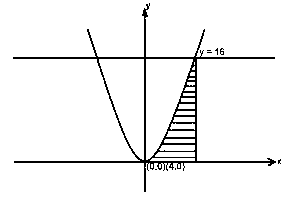
Question 0The diagram above is the graph of y = x2, the shaded area isA.64 square unitsB.128/3 square unitsC.64/3 square unitsD.32 square unitsE.Objective Show full explanation