Teacha
  • Courses
  • Mock Exams
  • For Tutors
  • For Schools
  • Pricing
Log InStart Free
  1. Past Questions
  2. /
  3. JAMB
  4. /
  5. Mathematics
  6. /
  7. 2007
  8. /
  9. Q0
Question 0Question image

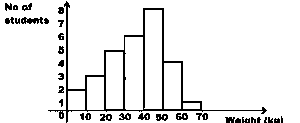
The histogram above represents the weights of students who travelled out to their school for an examination. How many people made the trip.

  • A.78
  • B.38
  • C.29
  • D.69
  • E.
Objective

Question details

Exam body
JAMB
Subject
Mathematics
Year
2007
Question no.
#0
Type
Objective
Previous · Q0In a basket, there are 6 grapes, 11 bananas and 13 oranges. If one fruit is… Next · Q0 A senatorial candidate had planned to visit seven cities prior to a primary…

More from this paper

  • Q0If 5, 8, 6 and 2 occur with frequencies 3, 2, 4 and 1 respectively. Find the…
  • Q0The pie chart above illustrate the amount of private time a student spends in a…
  • Q0The table above shows the number of pupils in each age group in a class. What is…
  • Q0What is the mean deviation of 3, 5, 8, 11, 12 and 21?
  • Q0The table above gives the frequency distribution of marks obtained by a group of…
  • Q0In how many ways can 6 subjects be selected from 10 subjects for an examination
See all Mathematics 2007 questions
Teacha

Africa's learning & exam readiness platform. Built for students, tutors, and schools.

Platform

  • Courses
  • Mock Exams
  • Past Questions

For You

  • I'm a Tutor
  • I'm a School
  • Pricing

© 2025 Teacha. Built for African learners, tutors, and schools. Teacha is not affiliated with WAEC, NECO, or JAMB. All past questions are sourced from publicly available materials.

Privacy PolicyTerms of UseCookie Policy