Teacha
  • Courses
  • Mock Exams
  • For Tutors
  • For Schools
  • Pricing
Log InStart Free
  1. Past Questions
  2. /
  3. JAMB
  4. /
  5. Mathematics
  6. /
  7. 2009
  8. /
  9. Q0
Question 0Question image

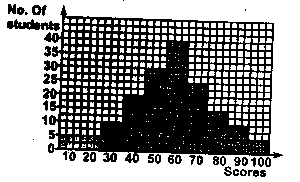
The histogram above represents the number of candidates that sat for Mathematics examination in a school. How many candidate scored more than 50 marks?

  • A.80
  • B.95
  • C.100
  • D.115
  • E.
Objective

Question details

Exam body
JAMB
Subject
Mathematics
Year
2009
Question no.
#0
Type
Objective
Previous · Q0In the figure above, TS//XY and XY = TY, o , o . Find the angle marked n. Next · Q0 The pie chart above represents 400 fruits on display in a grocery store. How…

More from this paper

  • Q0Substract 16418 9 from 18630 9
  • Q0If 55 x + 52 x = 77 10 find X
  • Q0Simplify \(7\frac{1}{12}-4\frac{3}{4}+2\frac{1}{2}\)
  • Q0Evaluate \(\frac{81.81+99.44}{20.09+36.16}\) correct to 3 significant figures.
  • Q0A man bought a second-hand photocopying machine for N34,000. He serviced is at a…
  • Q0A student spent 1 / 5 of his allowance on books, 1 / 2 of remainder on food and…
See all Mathematics 2009 questions
Teacha

Africa's learning & exam readiness platform. Built for students, tutors, and schools.

Platform

  • Courses
  • Mock Exams
  • Past Questions

For You

  • I'm a Tutor
  • I'm a School
  • Pricing

© 2025 Teacha. Built for African learners, tutors, and schools. Teacha is not affiliated with WAEC, NECO, or JAMB. All past questions are sourced from publicly available materials.

Privacy PolicyTerms of UseCookie Policy