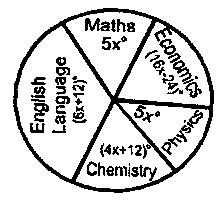
Question 0The pie chart above shows the statistical distribution of 80 students in five subjects in an examination. Calculate how many student offer Mathematics.A.30B.11C.50D.20E.Objective Show full explanation