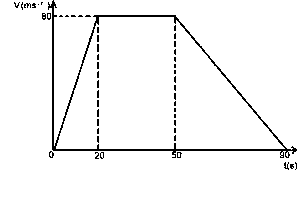
Question 0The diagram above shows the velocity-time graph of a vehicle. Its acceleration and retardation respectively areA.8.0 ms-2, 4,0 ms-2B.4.0 ms-2, 8.0 ms-2C.4.0 ms-2, 2.0 ms-2D.2.0 ms-2, 4.0 ms-2E.Objective Show full explanation