Teacha
  • Courses
  • Mock Exams
  • For Tutors
  • For Schools
  • Pricing
Log InStart Free
  1. Past Questions
  2. /
  3. NDA
  4. /
  5. Chemistry
  6. /
  7. 2016/2017
  8. /
  9. Q26
Question 26

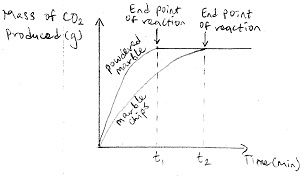
The graph below demonstrates the effect of

  • A.pressure on the rate of reaction
  • B.concentration on the rate of reaction
  • C.surface area on the rate of reaction
  • D.catalyst on the rate of reaction
Objective

Question details

Exam body
NDA
Subject
Chemistry
Year
2016/2017
Question no.
#26
Type
Objective
Previous · Q25Nuclear fission involves the spitting of a heavy element into two nuclei of Next · Q27 The electronic configuration of Mg2+ is

More from this paper

  • Q22234 90 Th = x y Pa + β In this reaction above, x and y are:
  • Q23Cancerous growths are Cured by exposure to
  • Q24When cathode rays are deflected onto the electrode of an electrometer, the…
  • Q28The minimum amount of energy required for a reaction to take place is
  • Q29A 50.0mg supply of iodine -131, used in hospital in the treatment of…
  • Q30Radioactive changes differ from ordinary chemical changes in that radioactive…
See all Chemistry 2016/2017 questions
Teacha

Africa's learning & exam readiness platform. Built for students, tutors, and schools.

Platform

  • Courses
  • Mock Exams
  • Past Questions

For You

  • I'm a Tutor
  • I'm a School
  • Pricing

© 2025 Teacha. Built for African learners, tutors, and schools. Teacha is not affiliated with WAEC, NECO, or JAMB. All past questions are sourced from publicly available materials.

Privacy PolicyTerms of UseCookie Policy