Teacha
  • Courses
  • Mock Exams
  • For Tutors
  • For Schools
  • Pricing
Log InStart Free
  1. Past Questions
  2. /
  3. BUK
  4. /
  5. Mathematics
  6. /
  7. 2016/2017
  8. /
  9. Q32
Question 32

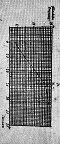
The graph below shows the cumulative frequency curve of the distribution of marks in a class est. What percentage of the students scored more than 20?
  • A. 8%
  • B. 68%
  • C. 28%
  • D. 17%
Objective

Question details

Exam body
BUK
Subject
Mathematics
Year
2016/2017
Question no.
#32
Type
Objective
Previous · Q31In how many ways can 2 students be selected from a group of 5 students in a… Next · Q33 Find the mean deviation of 1,2,3 and 4

More from this paper

  • Q34Find the value of x in the figure below
  • Q35Find the value of α 2 + β 2 if α + β = 2 and the distance…
  • Q36Find the remainder when 3x 3 + 5x 2 - 11x + 4 is divided by x + 3
  • Q37Given that the first and fourth terms of a G.P are 6 and 162 respectively, find…
  • Q38Factorize completely ac - 2bc - a 2 + 4b 2
  • Q39The length L of a simple pendulum varies directly as the square of its period T…
See all Mathematics 2016/2017 questions
Teacha

Africa's learning & exam readiness platform. Built for students, tutors, and schools.

Platform

  • Courses
  • Mock Exams
  • Past Questions

For You

  • I'm a Tutor
  • I'm a School
  • Pricing

© 2025 Teacha. Built for African learners, tutors, and schools. Teacha is not affiliated with WAEC, NECO, or JAMB. All past questions are sourced from publicly available materials.

Privacy PolicyTerms of UseCookie Policy