Question 1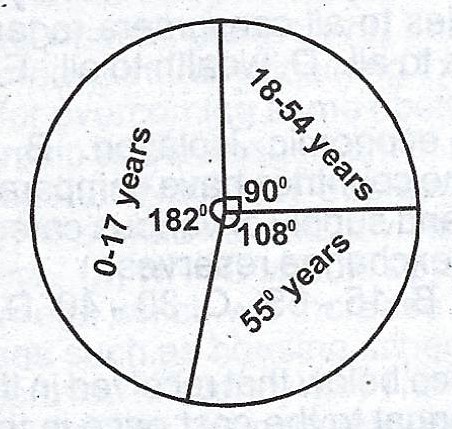
This is a pie-chart showing the age distribution of population. The total population is 120 million. The official school-leaving age is 18 years while the official retiring age is 55 years.
(a) From the above information, calculate the:
(i) Population of children between 0 and 17 years.
(ii) population of old people (55 + years);
(iii) work-ing population (18 - 54 years) .
(b) what is the economic implication of the above population structure?
Theory