Question 1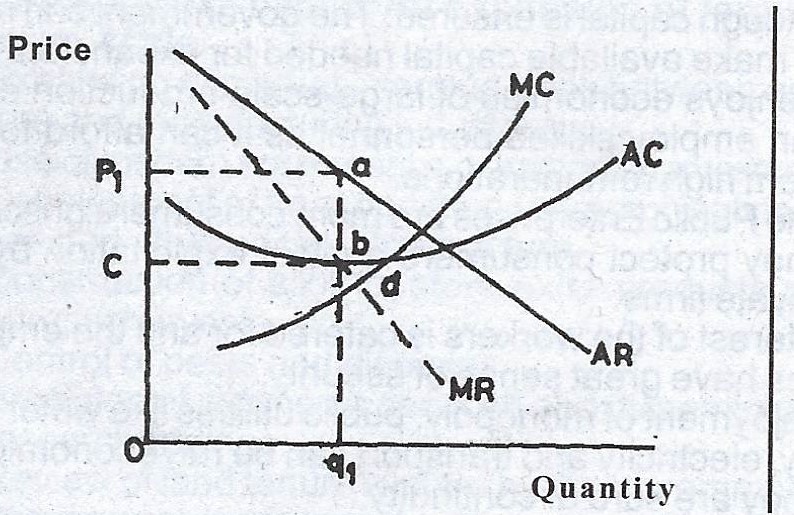
Use the diagram below to answer the questions that follow.
(b)(i) Which of the curves represents the monopoly demand curve?
(ii) What is the point on the diagram?
(iii) State the equilibrium price and quantity
(iv) Which area represent monopoly profits?
(c) If P\(_1\) q = 5 Naira and q\(_1\) = 50 units and C = 2 Naira, deter mine the monopoly profit.
Theory