Question 5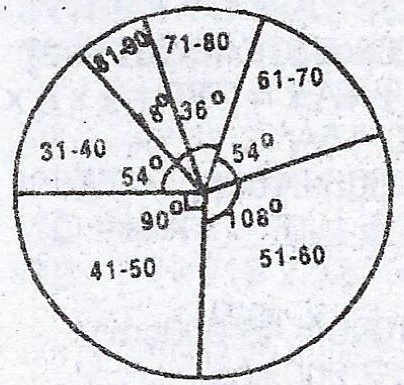
The pie chart shows the distribution of marks scored by 200 pupils in a test.
(a) How many pupils scored : (i) between 41 and 50 marks? ; (ii) above 80 marks ?
(b) What fraction of the pupils scored at most 50 marks?
(c) What is the modal class?
Theory