Question 4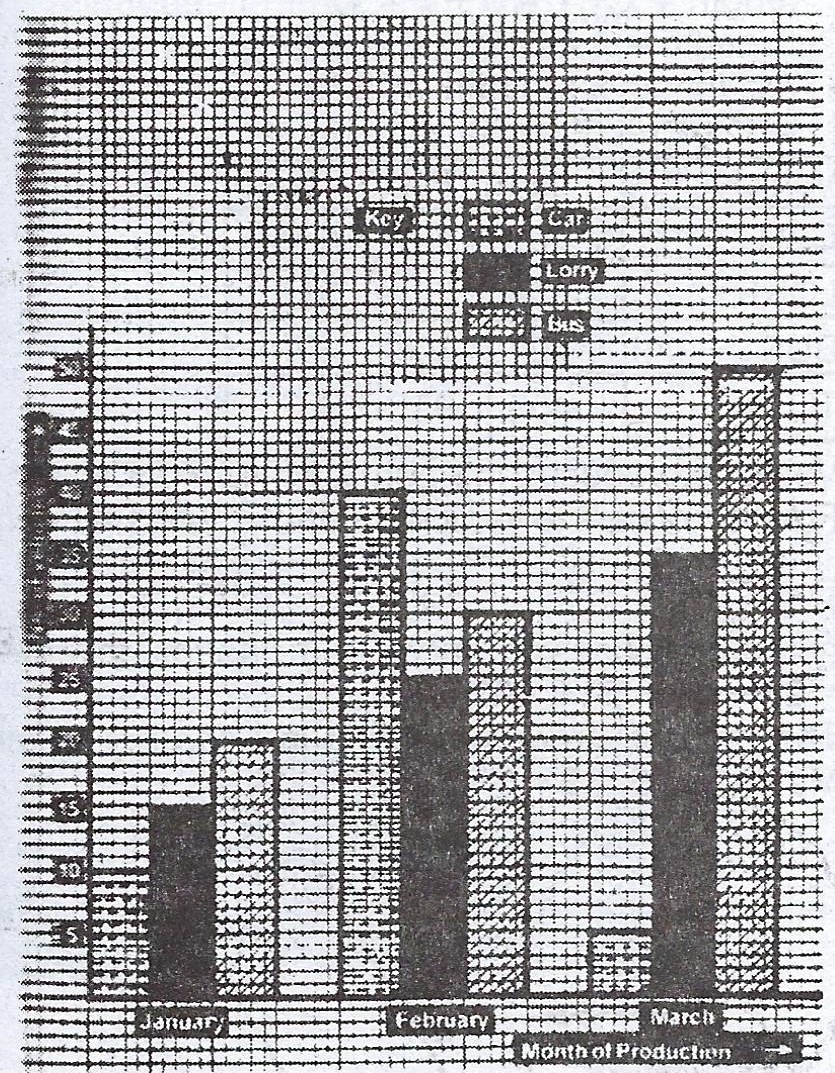
The diagram above shows the bar charts representing the number of vehicles manufactured by a company in January, February and March, 1992.
(a) How many vehicles were produced in February?
(b) What fraction of the vehicles manufactured in February were cars?
(c) How many buses were produced altogether from January to March, 1992?
(d) What is the ratio in the lowest term of the number of lorries produced in February to that in March?
Theory