Question 6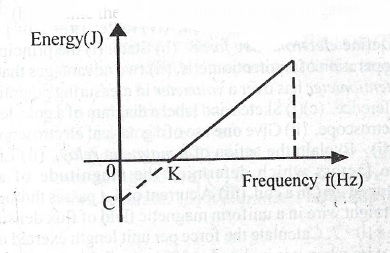
The diagram above represents the graph of electron energy against the frequency of the radiation incident on a metal surface. Interpret the: (a) slope of the graph; (b) intercept, OC; (c) intercept, OK.
Theory
The diagram above represents the graph of electron energy against the frequency of the radiation incident on a metal surface. Interpret the: (a) slope of the graph; (b) intercept, OC; (c) intercept, OK.