Teacha
  • Courses
  • Mock Exams
  • For Tutors
  • For Schools
  • Pricing
Log InStart Free
  1. Past Questions
  2. /
  3. JAMB
  4. /
  5. Biology
  6. /
  7. 2012
  8. /
  9. Q0
Question 0Question image

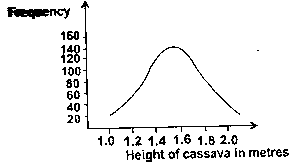
Use the diagram above to answer this question.

The graph illustrates

  • A.the highest frequency for height of 2 metres
  • B.a discontinuously varying character
  • C.a continuously varying character
  • D.total yield in a cassava farm
  • E.
Objective

Question details

Exam body
JAMB
Subject
Biology
Year
2012
Question no.
#0
Type
Objective
Previous · Q0Use the diagram above to answer this question. The function of the part labelled… Next · Q0 The largest number of cassava plants has an approximate height of

More from this paper

  • Q0Which of the following is most advanced in the evolutionary trend of animals?
  • Q0Which of the following is the lowest category of classification?
  • Q0Plants that show secondary growth are usually found among the
  • Q0The fungi are distinct group of eukaryote mainly because they have
  • Q0An arthropod that is destructive at early stage of its life cycle is
  • Q0An animal body that can be cut along its axis in any plane to give two identical…
See all Biology 2012 questions
Teacha

Africa's learning & exam readiness platform. Built for students, tutors, and schools.

Platform

  • Courses
  • Mock Exams
  • Past Questions

For You

  • I'm a Tutor
  • I'm a School
  • Pricing

© 2025 Teacha. Built for African learners, tutors, and schools. Teacha is not affiliated with WAEC, NECO, or JAMB. All past questions are sourced from publicly available materials.

Privacy PolicyTerms of UseCookie Policy