Question 0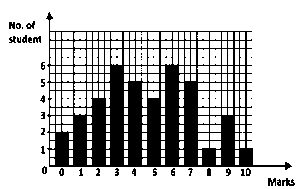
The bar chart above shows the distribution
The bar chart above shows the distribution
of marks in a class test. If the pass mark is 5,
what percentage of students failed the
test?
Objective