Question 1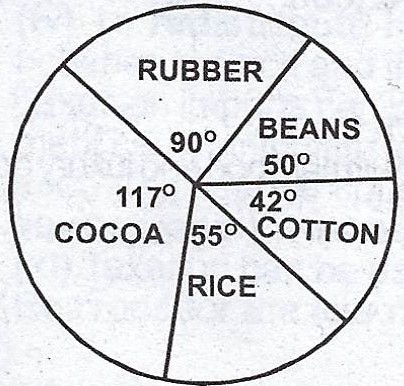
The pie chart here represents the hypothetical output of farmers in a country in a particular year. The total output of the crops was 72,000 tonnes.
(a) Calculate the quantity of each product.
(b) (i) By what quantity is the export crops greater than the food crops?
(ii) Which crop contributed the least and by what quantity?
(iii) Which crop has the highest output?
Theory