Question 12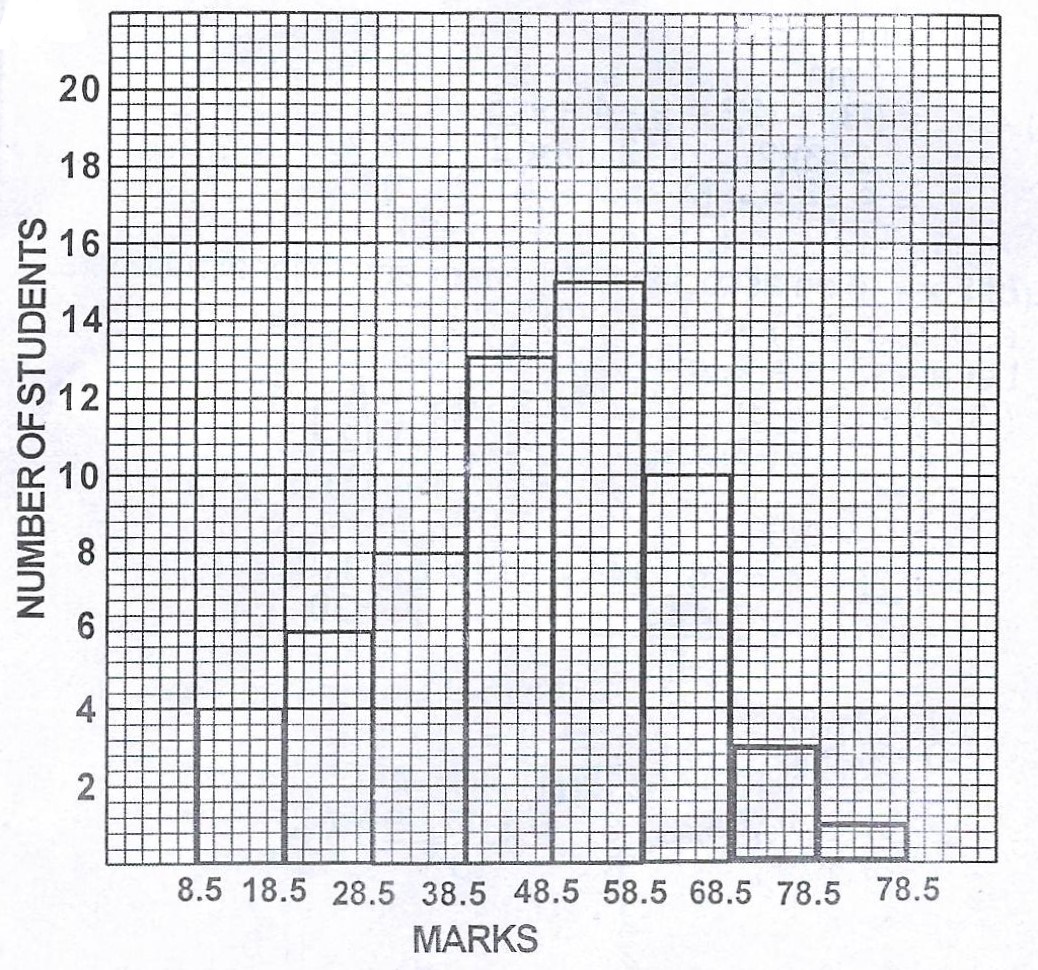
The histogram above represents the scores of some candidates in an examination.
(a) Using the histogram, construct a frequency distribution table indicating clearly the class intervals ;
(b) Draw a cumulative frequency curve of the distribution and use it to estimate the :
(i) median ; (ii) quartile deviation.
Theory