Question 1
Simplify \(\left(\frac{3}{4} - \frac{1}{3}\right)\times 4\frac{1}{3}\div 3\frac{1}{4}\)
Objective
Practice each question, then open it to see the full details.
Simplify \(\left(\frac{3}{4} - \frac{1}{3}\right)\times 4\frac{1}{3}\div 3\frac{1}{4}\)
(a) If p varies directly as \(r^{2}\) and p = 3.2 when r = 4, find the value of p when r = 6.5.
(b) Solve the simultaneous equations :
\(\frac{x}{2} + \frac{y}{4} = 1 ; \frac{x}{3} - \frac{y}{4} = \frac{-1}{6}\)

The table below gives the distribution of marks obtained by a number of pupils in a class test.
The mode of the distribution is
Without using Mathematical tables or a calculator, simplify :
(a) \(\sqrt{50} - 3\sqrt{2}(2\sqrt{2} - 5) - 5\sqrt{32}\)
(b) \(\frac{1}{2} \log_{10} \frac{25}{4} - 2 \log_{10} \frac{4}{5} + \log_{10} \frac{320}{125}\).

The table below gives the distribution of marks obtained by a number of pupils in a class test.
Find the median of the distribution
(a) Simplify : \(625^{\frac{3}{8}} \times 5^{\frac{1}{2}} \div 25\)
(b) Solve the following equations correct to one decimal place.
(i) \(\tan (\theta + 25)° = 5.145\)
(ii) \(5\cos \theta - 1 = 0\), where \(0° \leq \theta \leq 90°\).

The table below gives the distribution of marks obtained by a number of pupils in a class test.
How many pupils scored at least 2 marks?
In the diagram, PQRS is a circle with centre O and radius 7cm. SQ and PR intersect at K and < SKR = 90°. If the length of the arc SR is four times that of arc PQ, find the length of the arc SR. [Take \(\pi = \frac{22}{7}\)].
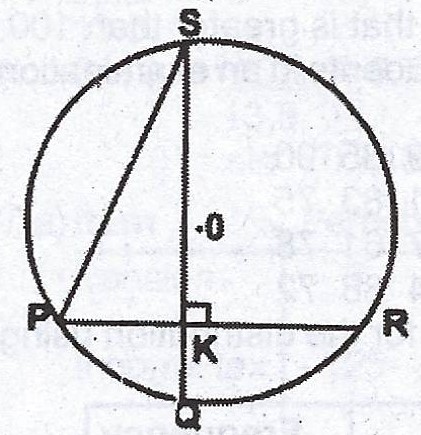

The table shows the number of suitcases possessed by a group of travellers.
| No. of suitcases | 0 | 1 | 2 | 3 | 4 | 5 |
| Travellers | 2 | 7 | 7 | 2 | 3 | 6 |
(a) Calculate the (i) median (ii) mean, correct to the nearest whole number.
(b) Draw a bar chart to represent the information.
(a) Simplify : \(\frac{\frac{1}{3}c^{2} - \frac{2}{3}cd}{\frac{1}{2}d^{2} - \frac{1}{4}cd}\)
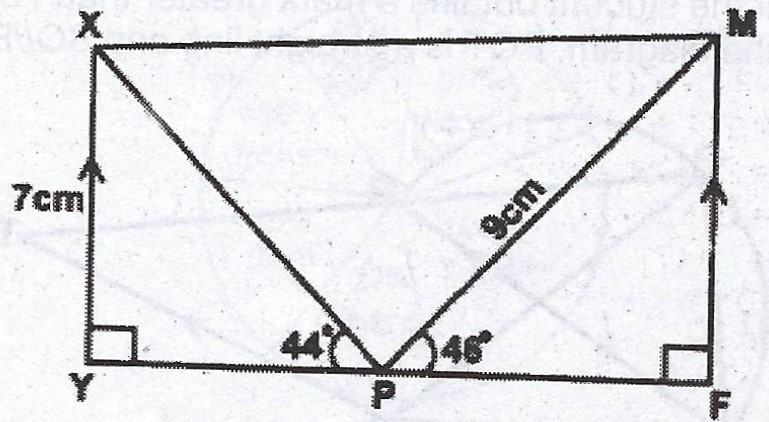
(b) In the diagram, YPF is a straight line. < XPY = 44°, < MPF = 46°, < XYP = < MFP = 90°, /XY/ = 7cm and /MP/ = 9 cm.
(i) Calculate, correct to 3 significant figures, /XM/ and /YF/ ; (ii) Find < XMP.
The table shows the monthly contributions and expenditure pattern of an employee in 1999.
| Item | Percentage |
| Pension | 5 |
| Income Tax | 25 |
| Food | 40 |
| Transport | 10 |
| Rent | 12.5 |
| Others | 7.5 |
(a) Draw a pie chart to illustrate the data.
(b) If the employee's gross monthly salary was N10,800.00, calculate (i) the pension contribution of the employee ; (ii) the income tax paid by the employee.
(c) If the pension contribution and income tax were deducted from the gross monthly salary, before payment, calculate the take- home pay of the employee.
(a) A = {1, 2, 5, 7} and B = {1, 3, 6, 7} are subsets of the universal set U = {1, 2, 3,...., 10}. Find (i) \(A'\) ; (ii) \((A \cap B)'\) ; (iii) \((A \cup B)'\) ; (iv) the subsets of B each of which has three elements.
(b) Write down the 15th term of the sequence, \(\frac{2}{1 \times 3}, \frac{2}{2 \times 4}, \frac{4}{3 \times 5}, \frac{5}{4 \times 6},...\).
(c) An Arithmetic Progression (A.P) has 3 as its first term and 4 as the common difference, (i) write an expression in its simplest form for the nth term ; (ii) find the least term of the A.P that is greater than 100.

The marks obtained by 40 students in an examination are as follows :
85 77 87 74 77 78 79 89 95 90 78 73 86 83 91 74 84 81 83 75 77 70 81 69 75 63 76 87 61 78 69 96 65 80 84 80 77 74 88 72.
(a) Copy and complete the table for the distribution using the above data.
| Class Boundaries | Tally | Frequency |
| 59.5 - 64.5 | ||
| 64.5 - 69.5 | ||
| 69.5 - 74.5 | ||
| 74.5 - 79.5 | ||
| 79.5 - 84.5 | ||
| 84.5 - 89.5 | ||
| 89.5 - 94.5 | ||
| 94.5 - 99.5 |
(b) Draw a histogram to represent the distribution.
(c) Using your histogram, estimate the modal mark.
(d) If a student is chosen at random, find the probability that the student obtains a mark greater than 79.
Three men, Bedu, Bakre and Kofi shared' N500 in the ratio 3:2: x respectively. If Bedu’s share is N150, find the value of x.
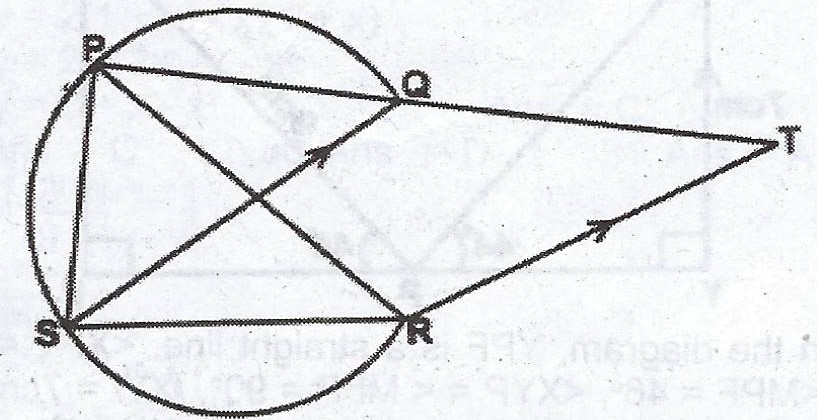
In the diagram, PQT is a straight line and SQ // RT.
(a) Join QR and show that : (i) < RPS = < QRT ; (ii) < PRS = < QTR.
(b) ABC is a triangle. The sides AB and AC are produced to D and E respectively such that < DBC = 132° and < ECD = 96°. Show that \(\Delta\) ABC is isosceles.
Simplify \(\left(1\frac{2}{3}\right)^2 - \left(\frac{2}{3}\right)^2\)
An aeroplane flies due west for 3 hours from P (lat. 50°N, long. 60°W) to a point Q at an average speed of 600km/h. The aeroplane then flies due south from Q to a point Y 500km away. Calculate, correct to 3 significant figures,
(a) the longitude of Q ;
(b) the latitude of Y . [Take the radius of the earth = 6400km and \(\pi = \frac{22}{7}\)].
Find the value of x which satisfies the equation
5(x-7)=7-2x
Using ruler and a pair of compasses only,
(a) construct a quadrilateral PXYQ such that /PX/ = 9.9 cm, /QX/ = 10.2 cm, < QPZ = 75°, /QY/ = 10.4 cm and PQ // XY.
(b) Construct the (i) locus \(l_{1}\) of points equidistant from X and Y ; (ii) locus \(l_{2}\) of points equidistant from QY and YX.
(c) Locate M, the point of intersection of \(l_{1}\) and \(l_{2}\).
(d) Measure /PM/.
The table below shows the values of the relation \(y = 11 - 2x - 2x^{2}\) for \(-4 \leq x \leq 3\).
| x | -4 | -3 | -2 | -1 | 0 | 1 | 2 | 3 |
| y | -13 | 11 |
(a) Copy and complete the table.
(b) Using a scale of 2 cm to 1 unit on the x- axis and 2 cm to 5 units on the y- axis, draw the graph of \(y = 11 - 2x - 2x^{2}\).
(c) Use your graph to find : (i) the roots of the equation \(11 - 2x - 2x^{2} = 0\) ; (ii) the values of x for which \(3 - 2x - 2x^{2} = 0\) ; (iii) the gradient of the curve at x = 1.
PQRS is a cyclic quadrilateral. If ∠QPS = 75°, what is the size of ∠QRS?

Find the value of x in the equation 3x\(^2\) - 8x - 3 = 0
Given, that \(4P4_5 = 119_{10}\), find the value of P


In the diagram, \(P\hat{Q}S = 65^o, R\hat{P}S = 40^2\hspace{1mm}and\hspace{1mm}Q\hat{S}R=20^o\hspace{1mm}P\hat{S}Q\)
Evaluate \((111_{two})^2 - (101_{two})^2\)
Given that x ≅ 0.0102 correct to 3 significant figures, which of the following cannot be the actual value of x?
Which of the following is/are not the interior angle(s) of a regular polygon? I.108° II. 116° III. 120°
If \(P = \sqrt{QR\left(1+\frac{3t}{R}\right)}\), make R the subject of the formula.

From the Venn diagram below, how many elements are in P∩Q?
From the Venn Diagram below, find Q' ∩ R.
The square root of a number is 2k. What is half of the number
Given that p varies as the square of q and q varies inversely as the square root of r. How does p vary with r?